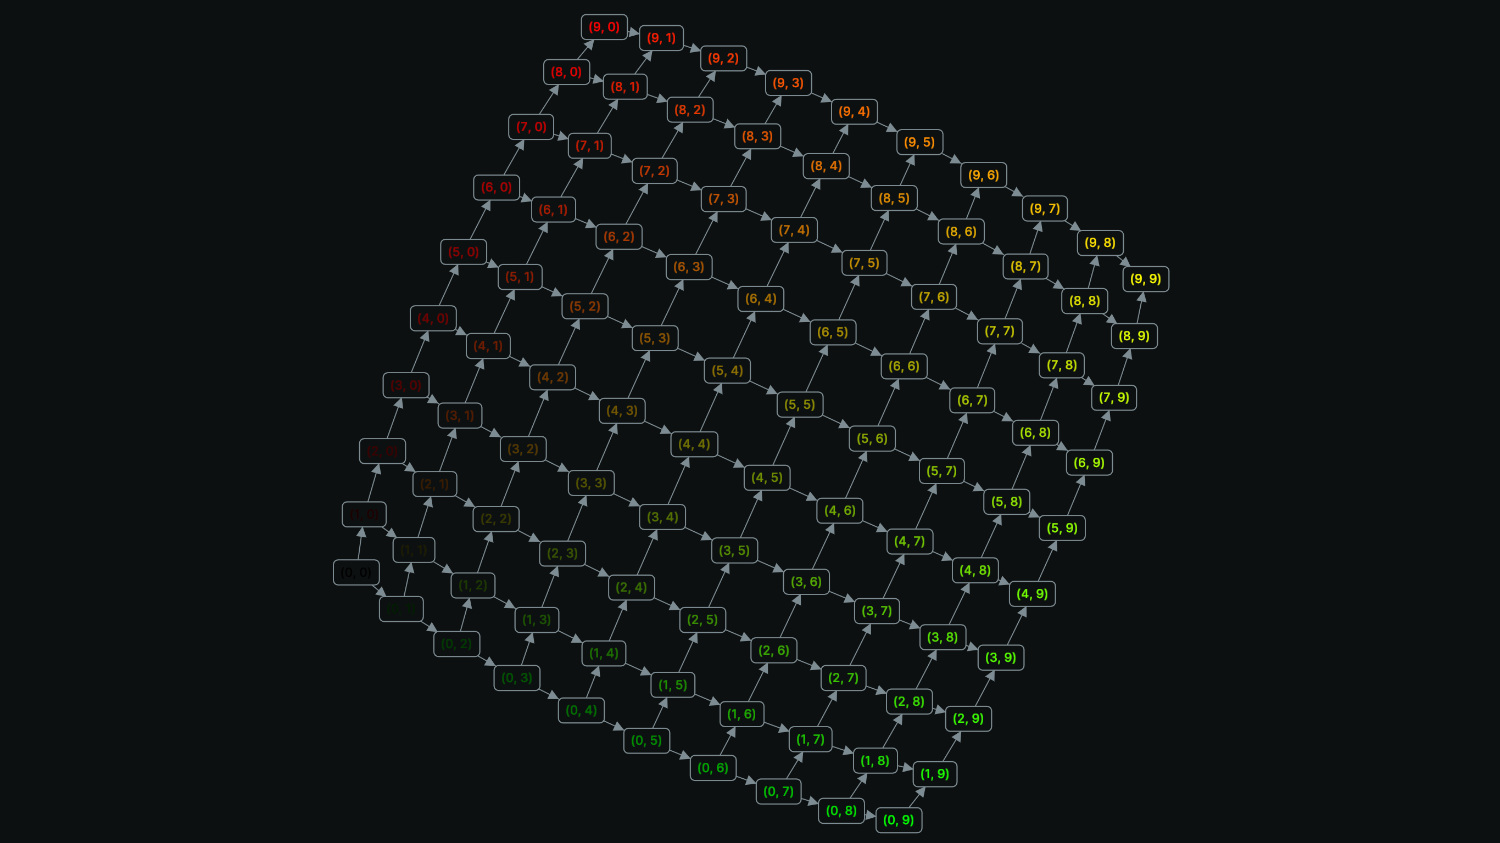
GraphView
A graph view to display time-variying, directed or undirected graph visualization.
Properties properties
visual_bounds visualbounds
Everything within these bounds is guaranteed to be visible.
Somethings outside of these bounds may also be visible due to letterboxing.
range: Controls the visible range of a 2D view.near_clip_plane: Controls the distance to the near clip plane in 3D scene units.
API reference links api-reference-links
Example example
Use a blueprint to create a graph view. use-a-blueprint-to-create-a-graph-view
"""Use a blueprint to customize a graph view."""

import rerun as rr
import rerun.blueprint as rrb

rr.init("rerun_example_graph_view", spawn=True)

rr.log(
    "simple",
    rr.GraphNodes(
        node_ids=["a", "b", "c"], positions=[(0.0, 100.0), (-100.0, 0.0), (100.0, 0.0)], labels=["A", "B", "C"]
    ),
)

# Create a Spatial2D view to display the points.
blueprint = rrb.Blueprint(
    rrb.GraphView(
        origin="/",
        name="Graph",
        # Note that this translates the viewbox.
        visual_bounds=rrb.VisualBounds2D(x_range=[-150, 150], y_range=[-50, 150]),
    ),
    collapse_panels=True,
)

rr.send_blueprint(blueprint)